Serum PD-1 Levels Change with Immunotherapy Response but Do Not Predict Prognosis in Patients with Hepatocellular Carcinoma
Article information

Abstract
Background/Aims
Programmed death receptor 1 (PD-1) is a promising new target for treatment of patients with hepatocellular carcinoma (HCC). A high expression level of programmed death-ligand 1 (PD-L1) is a possible prognostic indicator for poor outcome in other malignancies. Here, we investigated the clinical significance of PD-1 and PD-L1 in patients with HCC.
Methods
We enrolled patients with HCC who underwent surgical resection at Severance Hospital between 2012 and 2017 and investigated the levels of PD-L1 in HCC tissues (tPD-L1) and PD-L1/PD-1 in serum (sPD-L1/sPD-1). We also aimed to determine whether expression levels correlated with clinical and histological features.
Results
A total of 72 patient samples were analyzed. The median sPD-L1 and sPD-1 levels were 25.72 and 341.44 pg/mL, respectively. A positive correlation was detected between tPD-L1 and sPD-1 levels (R2=0.426, P<0.001). The median sPD-1 level increased linearly with tPD-L1 score (P=0.002). During the follow-up period, HCC recurred in eight (11.1%) patients and liver-related mortality occurred in eight (11.1%) patients. Higher sPD-L1 levels (≥19.18 pg/mL) tended to be associated with liver-related mortality (hazard ratio 6.866; 95% confidence interval, 0.804-58.659, P=0.078). sPD-1 levels of patients treated with nivolumab as a second-line therapy changed serially, and a >50% reduction in sPD-1 levels was observed immediately after nivolumab administration. However, sPD-1 level was not associated directly with prognosis in patients with advanced HCC.
Conclusions
The results demonstrated that PD-L1 and PD-1 levels changed according to the immunotherapy. However, no significant association with clinical outcome in patients with HCC was detected.
INTRODUCTION
Programmed death receptor 1 (PD-1), which is expressed on T-cells, B-cells, and natural killer (NK) cells, is a transmembrane protein that acts as an immune checkpoint receptor [1,2]. Two PD-1 ligands that have been identified are programmed death-ligand 1 (PD-L1) and programmed death-ligand 2 (PD-L2) [3]. PD-L1 is expressed by tumor cells and is up-regulated in several malignancies [2,4-6]. The interaction of PD-1 with PD-L1 results in the suppression of antitumor adaptive responses and immune escape of tumor cells [7-9]. This ultimately leads to poor prognosis in patients with malignancies. The blockade of immune checkpoints using monoclonal antibodies targeting the PD-1/PD-L1 pathway has shown promising results, especially in advanced solid tumors [10]. Elevated levels of soluble PD-L1 have been associated with poor prognosis in patients with renal cell carcinoma and in those with multiple myeloma [11,12].
Hepatocellular carcinoma (HCC) is the most common primary liver cancer, and its incidence is increasing [13]. In patients with advanced HCC, the few options for treatment include sorafenib and regorafenib. The results of clinical trials targeting the PD-1 axis in HCC have been recently reported [14]. The objective response rate was 20% and 15% in patients treated with nivolumab in phase 1/2 dose-expansion and dose-escalation phases [14]. In contrast, anti-PD-1 with nivolumab produced a disease control rate of 81.8%, with an objective response rate of 63.6% in patients with advanced HCC [15]. The prognostic role of PD-1/PD-L1 in HCC is not well understood. One study showed that high expression of PD-L1 was associated with poor outcome in patients with HCC [1,16]. In contrast, PD-L1 expression was not correlated directly with the survival of patients in the surgery alone group [17]. Thus, in patients with HCC, questions remain of whether PD-L1 levels in tissue (tPD-L1) are correlated with serum PD-L1 (sPD-L1)/serum PD-1 (sPD-1) levels, and whether a correlation exists with prognosis.
In this study, we investigated the levels of tPD-L1, sPD-L1, and sPD-1 in samples from patients with HCC. In addition, we aimed to evaluate the clinical significance of PD-1 and PD-L1 levels in patients with HCC.
METHODS
1. Patients
We enrolled patients with HCC who underwent surgical resection between 2012 and 2017 at Severance Hospital, Seoul, Korea. The diagnosis of HCC was made according to current guidelines [18], and matched tissue and serum samples were obtained from patients. The exclusion criteria were age ≤18 years, history of malignancy other than HCC, and history of liver transplantation. Ten serum samples from a healthy control cohort were retrieved from Yonsei Liver Blood Bank. In addition, serial serum samples were collected from 9 patients with HCC undergoing nivolumab treatment. Patients received 240 mg nivolumab intravenously every 2 weeks. This study was approved by the Independent Institutional Review Board of Severance Hospital (IRB number: 4-2016-1107) and conformed to the ethical guidelines of the 1975 Declaration of Helsinki.
2. Collection of tissue and blood samples
The tissue and blood specimens were obtained from a biobank at Severance Hospital, Seoul, Korea. Primary HCC tissues (n=78) and matching non-neoplastic tissue were collected immediately following surgery and stored at -80℃ until processing and use. On the day of surgery, blood samples were obtained from each patient. The serum was obtained by centrifugation (3,000×g for 10 minutes) and stored at -80℃ until analysis.
3. Immunohistochemistry and Enzyme-Linked Immunosorbent Assay (ELISA) assay
The quantification of PD-L1 expression and tumor-infiltrating lymphocytes (TIL), including cluster of differentiation (CD)3 and CD8, were analyzed by immunohistochemical detection. The tissue samples were immersed overnight in freshly prepared 10% neutral-buffered formalin. Fixed tissue samples were embedded in paraffin and sectioned serially into 6 μm slices. The slices were stained with hematoxylin and eosin. The paraffin sections were deparaffinized in xylene and rehydrated in gradually decreasing ethanol concentrations. The antigen epitopes were then unmasked using sodium citrate buffer (6.0 pH). Subsequently, the sections were incubated overnight at 4℃ with the primary antibody PD-L1 (13684S; Cell Signaling Technology, Inc., Danvers, MA, USA). After primary antibody incubation, the sections were incubated with the appropriate biotinylated secondary antibody (PK-6101; Vector Laboratories Inc, Burlingame, CA, USA) followed by treatment with freshly prepared 3,3'-diaminobenzidine substrate (SK-4100; Vector Laboratories Inc). The sections were lightly counter-stained with hematoxylin and mounted.
The expression levels of PD-L1 in HCC tissues were scored. Scores were determined based on the percentage of positively stained immunoreactive cells and the staining intensity in tumor cells (score 1, no staining; score 2, <10% and weak staining; score 3, 10-50% and moderate staining; and score 4, >50% and strong staining; Fig. 1) [16].
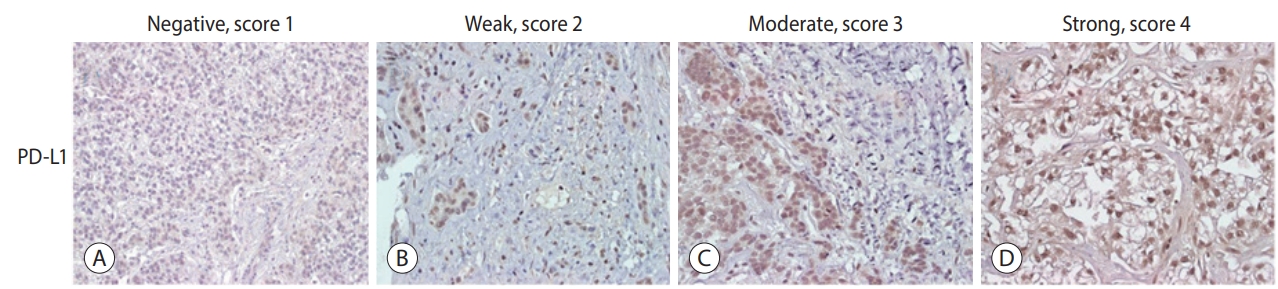
Immunohistochemical staining of hepatocellular carcinoma (HCC) tissues using anti-PD-L1. Representative staining patterns of HCC with negative, score 1 (A), weak intensity, score 2 (B), moderate intensity, score 3 (C), and strong intensity, score 4 (D) staining of PD-L1 are shown (×400). PD-L1, programmed cell death ligand 1.
The serum samples were assayed by using commercially available ELISA kits for PD-1 and PD-L1 (Invitrogen, Corp., Carlsbad, CA, USA), following the manufacturer’s protocol. Briefly, 96-well plates were incubated with standards at different concentrations, and serum samples were incubated for 2 hours at 37℃. After covering of the biotinylated antibodies and several aspiration/wash cycles, the plates were incubated with horseradish peroxidase-conjugated streptavidin at 37℃ for 1 hour and protected from light. Enzymatic reactions, as indicated by blue coloration on the addition of the substrate solution were developed and the absorbance was measured at 450 nm (A450) in a VersaMax ELISA microplate reader (Molecular Devices, San Jose, CA, USA). The protein levels were calculated according to standard curves. To properly evaluate the results, parallel investigations were made using healthy untreated controls. The minimum detectable level of sPD-L1 was 31.621 ng/mL. The level of soluble sPD-L1 was determined as described above, and the minimum detectable level of sPD-1 was 10.915 ng/mL.
4. Statistical analyses
Continuous data are presented as median values (Q1-Q3), and categorical data are presented as counts and percentages. For continuous data, Student's t -test was used to test for differences between groups. When the assumption of normality was violated, a nonparametric test (Mann-Whitney test or Wilcoxon signed-rank test) was performed. Differences between categorical variables were examined for statistical significance chi-squared test (or Fisher’s exact test, if appropriate). A two-sided P -value<0.05 was considered to indicate statistical significance. Pearson’s chi-squared test and Fisher’ s exact test were used for categorical data. Spearman’s correlation coefficient was used to assess the association between the levels of tPD-L1 and sPD-L1/sPD-1. The trend between sPD-L1/sPD-1 and tPD-L1 levels was tested using the Jonckheere-Terpstra test. Cox proportional-hazard models were performed to estimate the risk factors for overall survival. Cut-off values for sPD-L1/sPD-1 levels were calculated using the Contal and O’Quigley method. All analyses were performed using SAS software (version 9.4; SAS Institute Inc., Cary, NC, USA).
RESULTS
1. Baseline characteristics
A total of 72 patients with HCC were included in this study. The baseline characteristics of the study population are summarized in Table 1. The median age was 58.5 years and male sex predominated (80.6%). The etiologies of liver disease were hepatitis B (n=53, 73.6%), nonalcoholic steatohepatitis (n=13, 18.1%), hepatitis C (n=4, 5.6%), and others (n=2, 2.8%). The median alanine aminotransferase and platelet levels were 27.0 IU/mL and 147 × 103/μL, respectively. The median prothrombin time (internationalized ratio) was 1.0 and the median value of alpha-fetoprotein (AFP) was 12.6 ng/mL. The tPD-L1 score was 1 in two (2.8%) patients, 2 in 16 (22.2%) patients, 3 in 27 (37.5%) patients, and 4 in 27 (37.5%) patients.
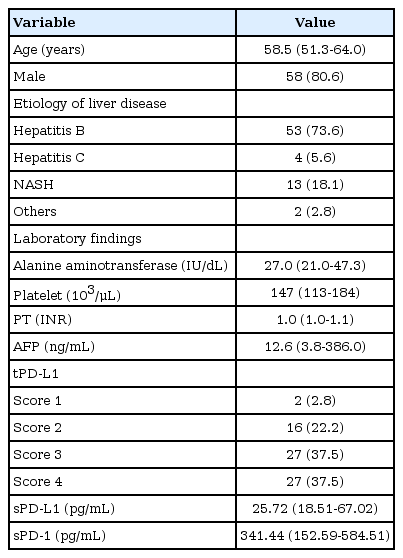
Baseline characteristics of the study population
2. Levels of sPD-L1 and sPD-1
The median sPD-L1 level was 25.72 pg/mL (Q1-Q3, 18.51-67.02 pg/mL). The optimal cut-off values for the prediction of survival and HCC recurrence were 19.18 pg/mL and 34.03 pg/mL, respectively. To define the sPD-L1 reference levels, sPD-L1 concentrations were determined from the serum of healthy blood donors. The median sPD-L1 level from 10 healthy donors (three male and seven female) with a median age of 28.5 years (Q1-Q3, 25.5-30.8 years) was 1.88 pg/mL (Q1-Q3, 0.53-4.09 pg/mL).
The median sPD-1 level was 341.44 pg/mL (interquartile range, 152.59-584.51 pg/mL). The optimal cut-off values for the prediction of survival and HCC recurrence were 279.10 pg/mL and 719.64 pg/mL, respectively. The median value from healthy donors was 28.5 pg/mL (Q1-Q3, 25.5-30.8 pg/mL). No difference was found between sexes. A positive correlation was detected between tPD-L1 and sPD-1 in patients with HCC (R2 =0.430, P <0.001). The median sPD-1 level increased linearly with the tPD-L1 score (P =0.002; Fig. 2).
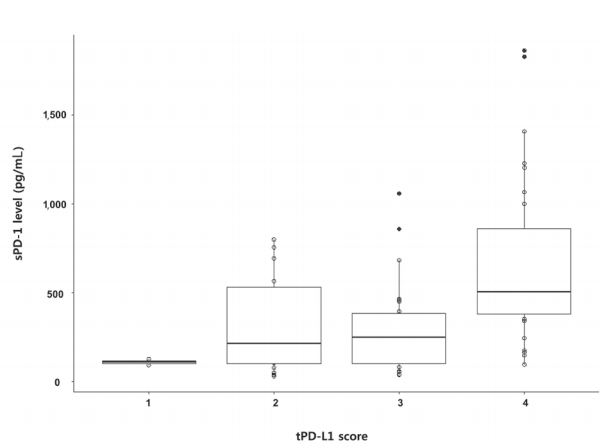
Linear trend between tPD-L1 and sPD-1 levels. tPD-L1, PD-L1 levels in tissue; sPD-1, PD-1 in serum; PD-1, programmed deathligand 1.
3. Liver-related mortality and recurrence of HCC
During the follow-up period (median, 16.1 months), liver-related mortality occurred in eight (10.3%) patients. No significant difference was observed in the baseline characteristics, except for the tPD-L1 score in patients with and without liver-related mortality (Table 2). The tPD-L1 scores were significantly higher in patients who died than in those who survived (tPD-L1 score ≥3, 100% vs. 71.9%, P =0.035).
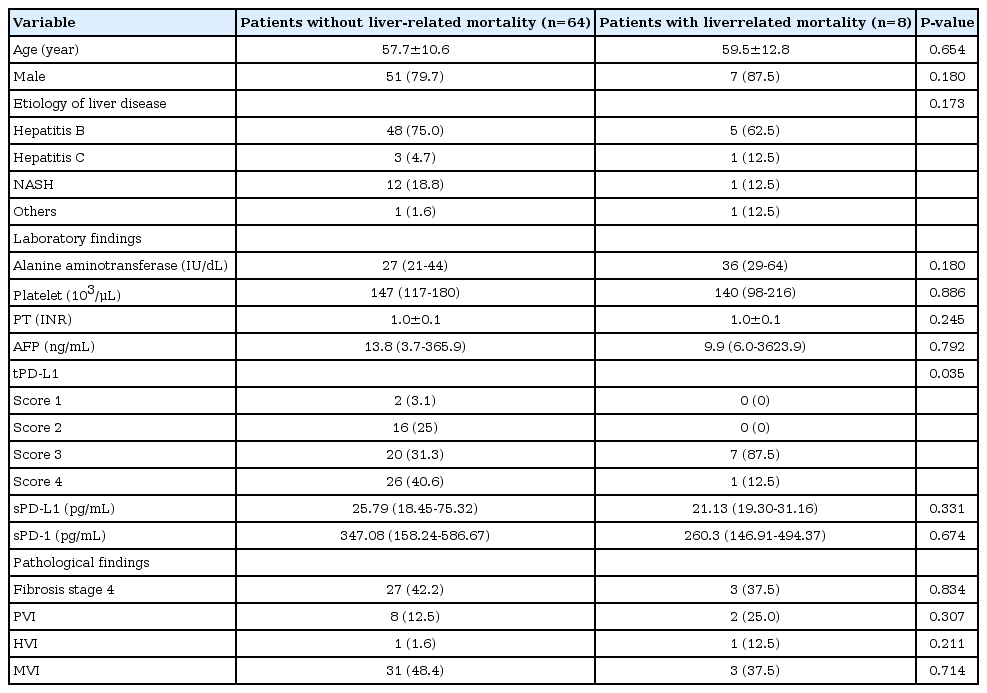
Comparison of patients without and with liver-related mortality
HCC recurred in eight (10.3%) patients during the follow-up. No difference was observed between patients with and without HCC recurrence (Table 3). In addition, no significant association was observed between the sPD-L1/sPD-1 level and recurrence of HCC (data not shown).

Comparison of patients without and with hepatocellular carcinoma recurrence
4. Immunohistochemical analysis of TIL
An immunohistochemical assessment of TILs was performed in an attempt to evaluate the contribution of relevant cells in cancer immune landscape, including cytotoxic, helper, and regulatory T-cells and NK cells. Considering the close relationship between CD3+ cell intensity and tPD-L1 expression, we found lower PD-L1 expression together with negative CD3+ infiltration in tumor and higher PD-L1 expression accompanied with positive CD3+ infiltration. A significant correlation was detected between PD-L1 expression and CD8+ lymphocytes and was the same as the correlation between PD-L1 expression and CD3+ lymphocytes (Supplementary Fig. 1).
5. Independent factors for survival in patients with HCC
A multivariate analysis showed that higher sPD-L1 levels (cut-off value, ≥19.2 pg/mL) tended to be associated with liver-related mortality (hazard ratio [HR], 6.866; 95% confidence interval, 0.804-58.659), but this association did not reach statistical significance (P =0.078; Table 4).
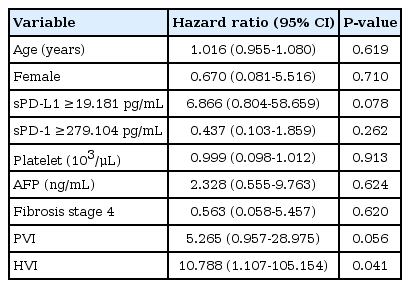
Independent factors for survival in patients with hepatocellular carcinoma
6. Changes of sPD-1 level in patients with advanced HCC treated with nivolumab
Serially collected serum samples from a total of nine patients with advanced HCC who received nivolumab treatment were included for analysis (Supplementary Table 1). The median age was 60.0 years, and male sex predominated (88.9%). All patients had extrahepatic metastasis. The mean number of nivolumab administrations was 9.4 (range, 6-13). The changes in PD-1 are shown in Fig. 3. Of the patients who responded to nivolumab treatment, the best responses during the treatment were categorized as partial response (PR; n=2, 22.2%), stable disease (SD; n=3, 33.3%), and progressive disease (PD; n=4, 44.5%). Except for one of the five favorable therapeutic responses, a reduction of sPD-1 by ≥50% compared with baseline was observed immediately after nivolumab administration. One of the favorable therapeutic responses showed a serial decrease after 9 doses but eventually showed PD. The final responses were PR and SD in one patient each after the administration of 12 doses, and these patients ultimately developed PD. However, no change in the sPD-L1 level that matched the therapeutic response was observed (Supplementary Fig. 2).
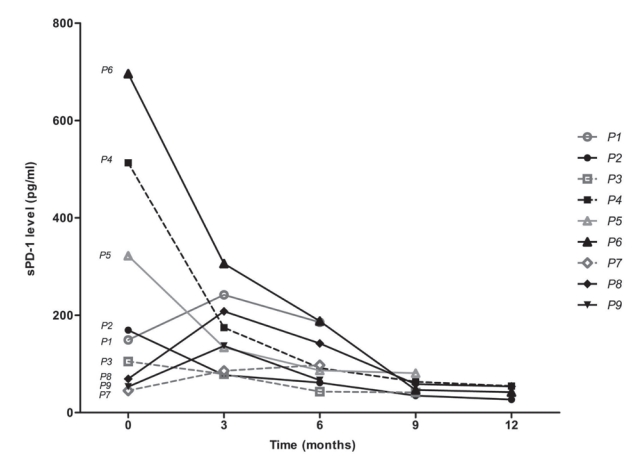
P1-P9 refers to each patient case. Change of sPD-1 levels according to nivolumab treatment. sPD-1, PD-1 in serum; PD-1, programmed death-ligand 1.
DISCUSSION
PD-1 inhibits T-cell proliferation, survival, and function. Anti-PD-1 drugs have shown dramatic treatment results for patients with melanoma and lung cancer. A recent phase I/II trial showed that nivolumab had a manageable safety profile and promising results were obtained in patients with advanced HCC [14]. The response rate was 15-20% in patients treated with nivolumab. However, few studies have examined the prognostic roles of PD-L1/PD-1 in HCC. Thus, we investigated PD-L1/PD-1 levels and their clinical significance in patients with HCC.
In another study, the median sPD-L1 levels were 500 pg/mL (range, 30-6,040 pg/mL) in patients with HCC and 780 pg/mL (range, 168-1,521 pg/mL) in healthy controls [1]. In our study, the result was 25 pg/mL, which was relatively low. This difference may have been due to the inclusion of patients with HCC at various stages (Barcelona Clinic Liver Cancer stages A-D) in the other study. In contrast, only patients with HCC at early stages who underwent surgery were included in our study. The median sPD-1 levels were 341 pg/mL (Q1-Q3, 153-585 pg/mL) in patients with HCC and 29 pg/mL (Q1-Q3, 26-31 pg/mL) in healthy controls.
No strong biomarker predicting postoperative outcome in HCC has been identified. In some studies, a preoperative serum AFP level (>400 ng/mL) was an independent prognostic factor for postoperative HCC survival [19,20]. However, in our study, higher AFP level (>400 ng/mL) was not associated with prognosis in patients with HCC. In addition, we found no correlation between the AFP and PD-L1/PD-1 levels (data not shown). PD-L1 expression has been associated with poor prognosis in malignancies, including melanoma, non-small cell lung cancer, esophageal cancer, gastric cancer, pancreatic cancer, renal cell cancer, and ovarian cancer [21-23]. Use of the PD-L1 level as a prognostic factor in patients with HCC has also been suggested [1]. High sPD-L1 levels were associated with mortality, independent of the stage of cirrhosis, levels of AFP and a macrophage activation marker. A characterization of tumor-infiltrating T-cell and macrophage subsets, including their expression of PD-1 and PD-L1, has been suggested for future biomarker assessment in patients with HCC [14]. However, we were unable to identify a prognostic role of PD-L1/PD-1 in patients with HCC.
sPD-1 levels in patients treated with nivolumab showed significant changes according to the treatment response. Four patients with best responses showed dramatic (>50%) reductions in their sPD-L1 levels immediately after nivolumab administration compared with baseline. However, these patients developed PD as treatment continued. Tumor cells can directly escape T-cell recognition by down-regulating major histocompatibility class class I expression and up-regulating the expression of PD-L1, CTLA-4, and other ligands of inhibitory T-cell receptors that mediate T-cell exhaustion [24]. NK cells may also affect the immune response in advanced HCC independently of T-cells; further studies are needed to explore this possibility.
Our study had several strengths. First, we measured the levels of PD-L1 in tissues and PD-L1/PD-1 in sera and investigated their association. Second, PD-1/PD-L1 level was checked in a small number of patients, but these reference values can be used for future research. Third, sera from patients who received anti-PD-1 treatment were collected serially, and the relationship of levels therein to prognosis was investigated. Lastly, we found that the PD-L1/PD-1 levels changed based on the circumstances and enhanced immune responses against tumors. However, we confirmed that the PD-L1/PD-1 level did not predict the clinical outcome in patients with early-stage HCC.
We are also aware of several issues in our study that remain unresolved. The limitations include the small sample size and the inclusion of only patients who received curative treatment. However, the collection of blood and tissue samples at the time of surgery allowed us to examine the samples at the proper time. This approach was advantageous because it allowed us to acquire and analyze patient information, even though the study was retrospective. Further studies involving large numbers of patients and examining the roles of T-cells and NK cells in patients receiving immunotherapy are warranted. In conclusion, PD-1/PD-L1 levels changed according to immunotherapy, but no significant association with clinical outcomes was found in patients with early-stage HCC.
Supplementary Materials
Supplementary datas can be found with this article online http://www.e-jlc.org/html/https://doi.org/10.17998/jlc.19.2.108.
Characteristics of nine patients who received nivolumab treatment
jlc-19-2-108-suppl1.pdfImmunohistochemical staining of tumor-infiltrating immune cells; with total (CD3+) and cytotoxic (CD8+) T lymphocytes from tPD-L1 negative and positive HCC tissue samples (×100). CD, cluster of differentiation; tPD-L1, PD-L1 levels in tissue; PD-1, programmed death-ligand 1, HCC, hepatocellular carcinoma.
jlc-19-2-108-suppl2.pdfChange of sPD-L1 levels according to nivolumab treatment. P1-P9 refers to each patient case. sPD-1, PD-1 in serum; PD-1, programmed death-ligand 1.
jlc-19-2-108-suppl3.pdfAcknowledgements
The authors are grateful to Hye Mi Bae (medical record reviewer, Yonsei Liver Center, Yonsei University College of Medicine, Seoul, Korea) for the help with this paper.
Notes
GRANT SUPPORT
This work was supported by an academic research fund of the Korean Liver Cancer Association for 2014.
The authors have no conflicts to disclose.