Gut-microbiome Taxonomic Profiling as Non-invasive Biomarkers for the Early Detection of Alcoholic Hepatocellular Carcinoma
Article information

Abstract
Background/Aims
Hepatocellular carcinoma (HCC) is a prevalent form of primary liver cancer and the fifth leading cause of worldwide cancer mortality. Though early diagnosis of HCC is important, so far lack of effective biomarkers for early diagnosis of HCC has been a problem. In this study, we searched for potential functional biomarkers of alcoholic HCC by using metagenomics approach.
Methods
Between September 2017 and April 2019, normal control (n=44), alcoholic liver cirrhosis (n=44), and alcoholic HCC (n=13) groups were prospectively enrolled and analyzed. Gut microbiota was analyzed using the 16S-based microbiome taxonomic profiling platform of EzBioCloud Apps and analyzing system.
Results
There was a statistically significant difference among groups in diversity (P<0.05). In the comparison of phylum between cirrhosis and HCC, Proteobacteria were increased and Bacteroidetes were decreased. Firmicutes were not significantly different among the three groups. In the taxonomic profiling, relative abundance of Lactobacillus in the cirrhosis and HCC groups showed richness (P<0.05). In the biomarker analysis between cirrhosis and HCC, obiquinome Fe-S protein 3, global nitrogen regulator, Vesicle-associated membrane protein 7, toxin YoeB, peroxisome-assembly ATPase, and nitrogen oxide reductase regulator were differently expressed (P<0.001).
Conclusions
Alcoholic HCC showed different expressions in the stool taxonomy and biomarker compared with that of cirrhosis and control. Therefore, new biomarkers using stool analysis for alcoholic HCC are necessary.
INTRODUCTION
Liver cirrhosis and hepatocellular carcinoma (HCC) constitute the most chronic forms of liver disease and are designated as end-stage liver diseases. HCC, which has a 9.1% mortality rate worldwide, is the fifth most common cancer, and is considered a serious health burden worldwide [1].
Current perspectives on the disease and promising treatments have been transformed by recent advances in basic and applied knowledge of the gut microbiota in humans [2]. Human gut microbiota is set up in complex ecosystems containing a wide range of bacterial species, the total mass of which is approximately 1-2 kg [3,4]. In addition, bacterial species in the gut are closely related to the host, and play an important role in bacterial translocation, mucosal immune system, and vitamin production [5]. Since the intestine is directly connected to the liver, gut microbiota disorders are causally related to liver diseases. The portal vein mediates the movement of nutrients and microbiota-related components along the enterohepatic axis [6-9].
Recently, using a newly developed diagnostic method, a dramatic relationship between gut microbiome and liver cirrhosis, and gut microbiome and HCC has been observed [10]. The intestinal environment consists of numerous bacteria in addition to archaea, eukaryotes, and viruses, all of which play an essential role in producing active metabolites, and maintaining homeostasis and important functions of a healthy host. Given its anatomical location, the liver is very closely related to the intestine. The liver is the first organ to be exposed to virulence factors derived from the intestine, including bacteria, damage-associated metabolites, and bacterial products, because it receives most of the blood and nutrient supply from the intestine through the portal vein [11,12]. Changes in the gut microbial community promote increased translocation of event bacteria and active metabolites, known as endotoxemia, leading to barrier disruption and triggering systemic inflammation. However, this has a severe impact on the progression of chronic liver damage such as nonalcoholic fatty liver disease and alcoholic liver disease [13,14]. These complications are often preterminal events in cirrhosis, and prevention and early management can improve the prognosis and progression to HCC. Therefore, the aim of the present study is to compare the gut microbiome found in patients among the normal, alcoholic liver cirrhosis, and HCC groups, and find an effective functional biomarker for the early diagnosis of HCC.
METHODS
1. Patients
The prospective cohort study was carried out between September 2017 and April 2019. A total of 101 patients comprising normal controls (n=44), alcoholic liver cirrhosis (n=44), and alcoholic HCC (n=13) groups were prospectively enrolled and analyzed. This prospective cohort study involved patients with cirrhosis and HCC who were followed-up at the Liver Unit of the Hallym University Medical Center. The diseases of the patients were treated regardless of the study.
Patients who were >20 years old, had liver function test with an aspartate aminotransferase (AST)/alanine aminotransferase (ALT) >1 and elevated AST (ALT) level, and an alcohol consumption history of more than 40 g/day (for women) and 60 g/day (for men) during the last 7 days before screening were enrolled. Their last drinks were within 48 hours prior to admission. The exclusion criteria were as follows: patients with viral hepatitis, nonalcoholic hepatitis, autoimmune hepatitis, pancreatitis, hemochromatosis, Wilson’s disease, and drug-induced liver injury. This study was conducted in conformance with the ethical guidelines from the 1975 Helsinki Declaration as it is reflected by a prior approval by the institutional review board for human research in hospital participating in the trial (2016-134). Informed consent for enrollment was obtained from each participant.
Baseline evaluation was performed on complete blood count, liver function testing, and viral markers, and patients with alcoholic liver cirrhosis and alcoholic HCC were scanned at the abdomen (abdominal computed tomography). AST, ALT, total bilirubin, gamma-glutamyl transferase, albumin, prothrombin time, international normalized ratio, creatinine, and α-fetoprotein were included for serum biochemical parameters. Tests for hepatitis viruses and the human immunodeficiency virus were conducted in all patients. Hepatitis A immunoglobulin G (IgG) and IgM antibodies were used for the detection of hepatitis A virus; the IgM antibody against the hepatitis B core antigen and the hepatitis B surface antibody against the hepatitis B surface antigen were used for the detection of hepatitis B virus; anti-hepatitis E IgG and IgM antibodies were used for the detection of hepatitis E virus; and anti-hepatitis C antibodies with or without the presence of hepatitis C RNA were used for the detection of hepatitis C.
Enrolled patients and control groups were subjected to stool sampling and clinical analysis. Clinical data was matched with the metagenomics data simultaneously. Fecal samples were obtained noninvasively in a plastic collection kit at any time during the day. All samples were stored at -80°C. In the case of cirrhosis and HCC, stool samples were collected upon admission at the hospital and kept in a refrigerator at -80°C. In the case of normal control, the subjects collected the stool samples at home, and kept stool box at -20°C in a refrigerator. They sent stool box with the stools in iced state to the hospital, where the stool samples were received and kept at -80°C in a refrigerator.
2. Stool analysis for the metagenomics
Metagenomic DNA was extracted with a QIAamp stool kit and amplification of the V3-V4 region of the bacterial 16S rRNA gene was conducted using barcoded universal primers. Polymerase chain reaction (PCR) was performed with the following conditions: an initial denaturation at 95°C for 5 minutes, 20 cycles of 95°C for 30 seconds, 55°C for 30 seconds, and 72°C for 30 seconds, followed by a final extension at 72°C for 10 minutes. Purification of the amplicons was conducted with an Agencourt AMPure XP system (Beckman Coulter Inc., Sykesville, MD, USA), and quantification of the purified amplicons was conducted using PicoGreen and quantitative PCR. After pooling of the barcoded amplicons, sequencing was carried out using a MiSeq sequencer on the Illumina platform (ChunLab Inc., Korea) according to the manufacturer’s specification.
Microbiome profiling was conducted with the 16S-based Microbial taxonomic profiling (MTP) platform of EzBio-Cloud Apps (ChunLab Inc., Seoul, Korea). After taxonomic profiling of each sample, the comparative MTP analyzer of EzBioCloud Apps was used for comparative analysis of the samples. In the MTP platform of ChunLab, preprocessing of the sequencing reads was conducted using the following five steps: 1) filtering of low-quality reads, 2) merging of the paired-end reads, 3) removal of barcode and primer sequences, 4) taxonomic assignment of the reads, and 5) removal of chimeric sequences. Taxonomic assignment of the reads was conducted with ChunLab’s 16S rRNA database (DB ver. PKSSU4.0) [15]. OUT picking was conducted with UCLUST and CDHIT with 97% of similarity cutoff [16]. Then, Good’s coverage, rarefaction, and alpha-diversity indices including Abundance-based Coverage Estimator (ACE), and the number of OTUs found in MTP were calculated. Betadiversity, including PCoA clustering, was shown in the comparative MTP analyzer. All 16S rRNA sequences were deposited in the ChunLab’s EzBioCloud Microbiome Database and the sequencing reads of the 16S rRNA gene from this study were deposited in the NCBI Short Read Archive.
3. Quantification of bacterial amounts by quantitative real-time PCR
The relative amounts of total bacteria were measured using quantitative real-time PCR based on the 16S rRNA gene. The 16S rRNA gene was amplified using the primers 340F (5′-TCCTACGGGAGGCAGCAG-3′) and 518R (5′-ATTACCGCGGCTGCTGG-3′) with the TaKaRa PCR Thermal Cycler Dice Real Time System III (Takara Bio Inc., Kusatsu, Japan). Triplicate reactions were performed for each sample with a final volume of 25 μL comprising 12.5 μL of 2X SYBR Premix Ex Taq (Takara Bio Inc.), 10 μM of each primer, and 2 μL of DNA template (ten-fold diluted metagenomic DNA) or distilled water (negative control). The conditions for the reaction were as follows: initial denaturation at 95°C for 30 seconds; 40 cycles of denaturation at 95°C for 5 seconds, annealing at 60°C for 30 seconds. Standard curves were generated from parallel PCRs with serial log-concentrations (1 × 10²-1 × 10⁸) of the copy number of the 16S rRNA gene from Escherichia coli w3110.
4. Sequence analysis
Raw sequence reads were merged, and sequences with short read lengths (< 430 bp of merged reads) or low quality score and chimeric reads were trimmed using USEARCH (ver. 11.0.667). Primer sequences were removed from the merged sequences. Then, the resultant sequences were stepwise clustered into operational taxonomic units (OTUs) by 97% identity with the EzTaxon-e database, and taxonomic positions of representative sequences in each OTU cluster were assigned [17]. To compare diversity indices among samples, the read numbers were normalized using random subsampling, and the diversity indices were calculated using Mothur [18]. Principal coordinate analysis (PCoA) plots were generated to compare microbiota composition among samples [19]. The significantly differential taxa between groups were determined using Linear Discriminant Analysis Effect Size [20].
5. Data analysis
Unless otherwise stated, all clinical data are expressed as mean ± standard deviation. A paired t-test, independentsamples t-test, and analysis of covariance were used to assess the significance of the data. The differences in microbiota between groups were analyzed using the Mann-Whitney U-test and Kruskal-Wallis test in the R software. Permutation tests were used to determine the significance of the PCoA plot result. Values of P <0.05 were considered as statistically significant. Routine blood test data were analyzed using statistical software (SPSS, version 19.0, SPSS, Inc., Chicago, IL, USA) and GraphPad Prism version 6.0 for Windows (GraphPad Software Inc., San Diego, CA, USA).
RESULTS
1. Baseline characteristics of patients
The mean age of the patients was 58.0 ± 10.0 years and 68 patients (73.7%) were male. The number of the normal control group was 44 (43.6%) and 20 (47.7%) were male. The number of the alcoholic liver cirrhosis group was 44 (43.6%) and 35 (79.5%) patients were male. The number of the alcoholic HCC group patients was 13 (12.9%) and 12 (92.3%) patients were male (Table 1).

Baseline characteristics of patients
2. Diversity of taxonomy
We compared alpha diversity in the normal control, alcoholic liver cirrhosis, and alcoholic HCC groups using the Wilcoxon rank-sum test. There was a statistically significant difference between the normal control and the alcoholic liver cirrhosis groups (P <0.001). In addition, the alcoholic HCC group showed statistically significant difference compared with the normal control group (P <0.05). There was no statistically significant difference between the alcoholic liver cirrhosis and alcoholic HCC groups (P =0.177) (Fig. 1).
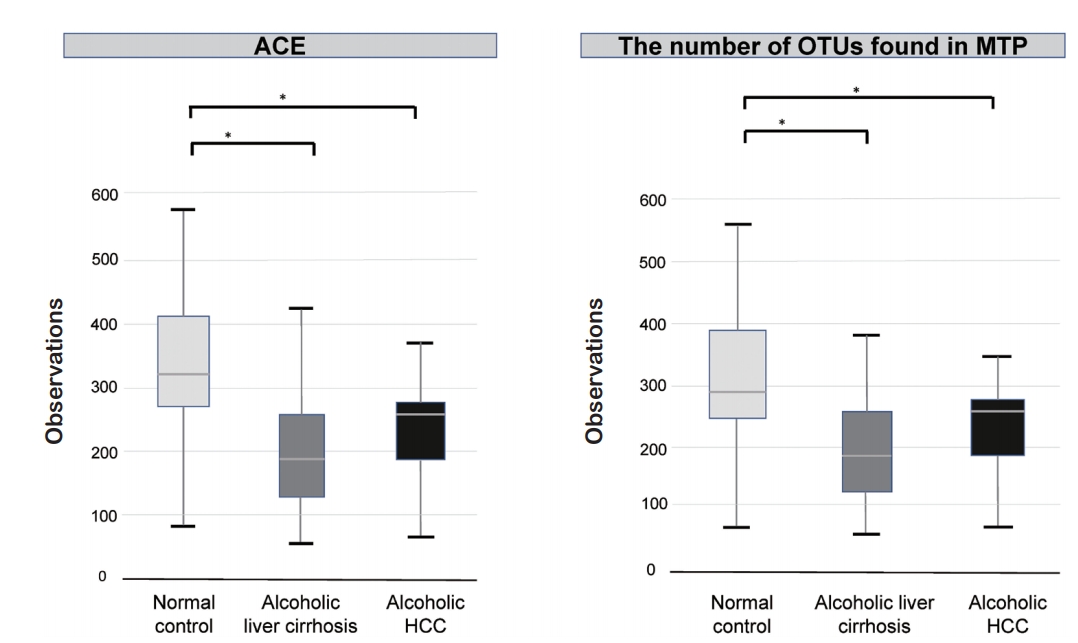
Alpha diversity in the normal control, alcoholic liver cirrhosis, and alcoholic hepatocellular carcinoma (HCC) groups. Alcoholic liver cirrhosis and alcoholic HCC groups showed decrease alpha diversity compared to that of the normal control group. ACE, Abundance-based Coverage Estimator; OTU, operational taxonomic unit; MTP, microbial taxonomic profiling. *P<0.001.
Additionally, we compared beta diversity in the normal control, alcoholic liver cirrhosis, and alcoholic HCC groups. The alcoholic liver cirrhosis and alcoholic HCC groups had similar beta diversity, but the normal control group showed different map pattern (Fig. 2).
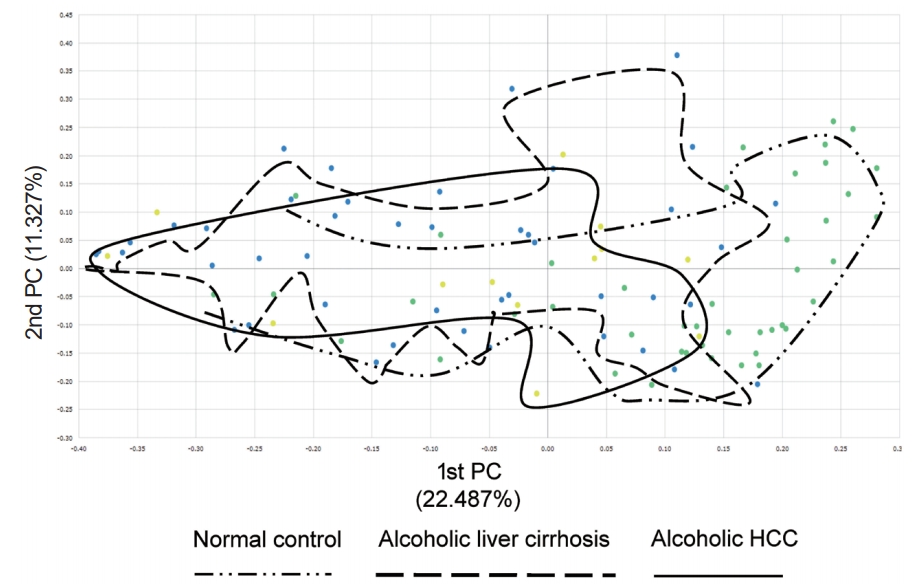
Beta diversity in the normal control, alcoholic liver cirrhosis, and alcoholic hepatocellular carcinoma (HCC) groups. Alcoholic liver cirrhosis and alcoholic HCC groups had similar beta diversity and showed different patterns compared with that of the normal control group.
3. Stool analysis for metagenomics
For comparison of the taxonomic composition at the phylum level, Proteobacteria increased in the alcoholic liver cirrhosis and alcoholic HCC groups compared with that in the normal control group. Composition of Firmicutes was not significantly different among the normal control, alcoholic liver cirrhosis, and alcoholic HCC groups. Verrucomicrobia appeared only in the cirrhosis group, whereas Actinobacteria appeared in both alcoholic liver cirrhosis and alcoholic HCC groups (Fig. 3).
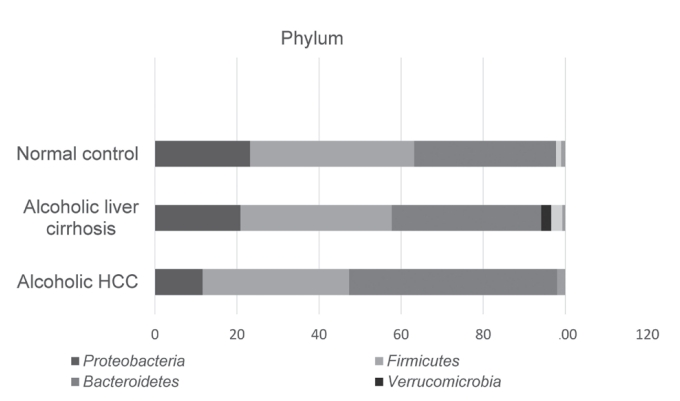
Phylum level averaged taxonomic compositions of the microbial taxonomic profiling sets. HCC, hepatocellular carcinoma.
We compared Lactobacillus taxonomic relative abundance in the normal control, alcoholic liver cirrhosis, and alcoholic HCC groups. There was a statistically significant difference between the normal control and the alcoholic liver cirrhosis groups (P <0.001), and a statistically significant difference between the normal control and alcoholic HCC groups (P <0.05). There was no statistically significant difference between the alcoholic liver cirrhosis and alcoholic HCC groups (P =0.171) (Fig. 4).
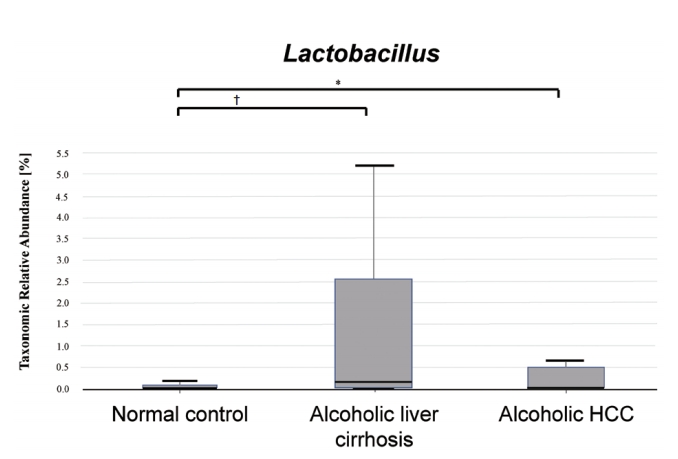
Lactobacillus taxonomic relative abundance in the normal control, alcoholic liver cirrhosis, and alcoholic hepatocellular carcinoma (HCC) groups. Alcoholic liver cirrhosis and alcoholic HCC groups showed increased Lactobacillus compared to that in the normal control group. * P<0.05; † P<0.001.
Firmicutes to Bacteroidetes ratio was compared in the normal control, alcoholic liver cirrhosis, and alcoholic HCC groups. There were no statistically significant differences in all three groups (normal control group vs. alcoholic liver cirrhosis group, P =0.249; normal control group vs. alcoholic HCC group, P =0.246; alcoholic liver cirrhosis group vs. alcoholic HCC group, P =0.690) (Fig. 5).

Firmicutes to Bacteroidetes ratio in the normal control, alcoholic liver cirrhosis, and alcoholic hepatocellular carcinoma groups. F/B, Firmicutes/Bacteroidetes.
4. Functional biomarker
Functional biomarker analysis was performed in the alcoholic cirrhosis and alcoholic HCC groups using the Kruskal-Wallis H test. The following six functional biomarkers were significantly different in the alcoholic liver cirrhosis and alcoholic HCC groups: 1) NADH dehydrogenase (obiquinome) Fe-S protein 3 (P =0.00014), 2) CRP/FNR family transcriptional regulator, global nitrogen regulator (P =0.00020), 3) Vesicle-associated membrane protein 7 (P =0.00087), 4) Toxin YoeB (P =0.00094), 5) Peroxisome-assembly ATPase (P =0.00095), 6) CRP/FNR family transcriptional regulator, nitrogen oxide reductase regulator (P =0.00097) (Table 2). We checked AFP and compared it with biomarker. Unfortunately, we did not find any relation between AFP and biomarker.
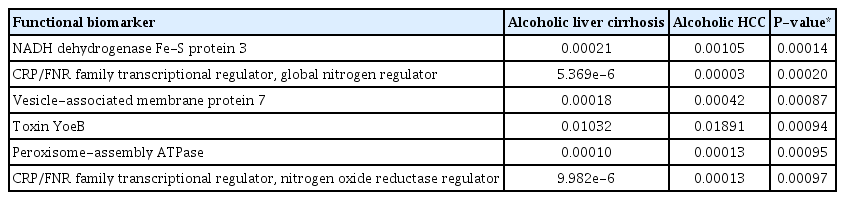
Functional biomarker analysis in alcoholic liver cirrhosis and alcoholic HCC groups
DISCUSSION
HCC is a highly complex and heterogeneous disease that affects all populations across the globe. However, the incidence of HCC may vary due to regional and geographical differences in the pervasiveness of causal factors [21]. HCC has been linked to a multitude of etiological risk factors and cofactors; in approximately 80-90% of patients, cirrhosis precedes HCC [22,23]. Of the myriad of factors associated with HCC, the most eminent factors include chronic hepatitis B and C viral infections, and chronic alcohol consumption [24].
Another factor that emerged in the past decade is gut dysbiosis. Irrespective of their prominence, disrupted gut barrier function suggests consequences of hepatic cell damage. Moreover, some evidence has shown a link between altered gut microbiota and increased intestinal permeability that can lead to diseased progression at various stages and might promote the progress of HCC throughout all these stages [25]. The common underlying causes of cirrhosis have been determined as crucial risk factors of HCC [26,27]. However, HCC can occur in non-cirrhotic livers, which accounts for approximately 20% of all HCC cases [28].
In this study, there was a statistically significant difference between the normal control and the alcoholic liver cirrhosis groups (P <0.001) in diversity. Recently, a dramatic relationship was observed between the microbiome and HCC [10]. A previous report suggested that severe alcoholic hepatitis had elevated levels of Actinobacteria and reduced levels of Bacteroidetes [29]. Our study also revealed reduced levels of Bacteroidetes in the alcoholic cirrhosis group. The microbiome provides a biomarker that can be tested for the risk of a disease and its progression; nevertheless, it remains unknown whether it is the cause or outcome of the disease or whether it is an inferential risk factor or modulator of the disease. Taken together, the microbiome might be related to HCC development and microbiome-related biomarkers are necessary for the diagnosis and treatment of HCC.
In carcinogenesis, cytokines and T-cells are important. The intestinal flora is critically involved in the pathogenesis of HCC by creating an anti-inflammatory microenvironment, which is dependent on liver lipopolysaccharide (LPS). Alistipes, Butyricimonas, Mucispirillum, Oscillibacter, Parabacteroides, Paraprevotella, and Prevotella were classified as enriched genera in this study, among which Oscillibacter species stimulate the differentiation of anti-inflammatory regulatory T-cells (Treg cells) that produce interleukin-10 (IL-10), and Parabacteroides species have proven to withhold inflammation by restraining inflammatory cytokines secretion and promoting the release of anti-inflammatory cytokines IL-10 [30,31]. Along with the aforementioned genera, the species Akkermansia muciniphila , Bacteroides fragilis, Parabacteroides distasonis, and Alistipes shahii were also significantly enriched. Alistipes shahii tends to modulate the gut by abating tumor growth, and Bacteroides fragilis acts by stimulating Treg cells for IL-10 production [32-34].
Chronic alcohol consumption increases intestinal permeability, leading to high levels of endotoxin, such as LPS [35], which is produced by Gram-negative bacteria. LPS is transported directly through the hepatic portal vein, which acts as a pivotal mediator of inflammation in alcoholic liver disease. LPS enables the production of reactive oxygen species and TNF-α activation by Kupffer cells, and leads to inflammation or injury to the liver. In addition, these pro-inflammatory cytokines and LPS cause the release of excess amounts of collagen and α-smooth muscle actin, which activates hepatic stellate cells and further promotes fibrosis [36-39].
Current data from animal and clinical studies point to the gut-liver axis that will bring promising results for primary or secondary prevention of HCC. The microbiome provides biomarkers to test the risk and progression of the disease. Nevertheless, whether it is the cause or effect of this disease or whether it is an estimated risk factor or modulator of the disease is unknown. Therefore, such biomarkers have the potential of diagnostic and prognostic mechanisms, a condition that is difficult to achieve. However, in the light of the metagenomic revolution, the study of its composition and function is, after all, an important goal for understanding the progression of cirrhosis to HCC.
In this study, we found that the taxonomic differences between the normal control and alcoholic liver cirrhosis, alcoholic HCC groups. In addition, functional biomarkers with statistically significant differences between the alcoholic liver cirrhosis and the alcoholic HCC groups were identified. Therefore, stool may be a useful diagnostic tool for alcoholic HCC.
Notes
AUTHOR'S CONTRIBUTION
Jun Seok: analysis and interpretation of the data, collection and assembly of data, drafting of the article. Ki Tae Suk: conception and design, revision of the article, final approval of the article.
The authors declare no conflicts of interest relevant to this article.